Barbados Land Price Index
This update of the Barbados Land Price Index features data on the vacant lands sales in Barbados up to November 2019. The last time the index appeared was in the The Red Book 2018 and featured partial 2017 data. At the time the index was 89.4, just over 10 points below our index starting year of 2009. The adjusted full year for 2017 is revised upwards to 93.4 which is currently the lowest point on the index. The index recovered to 97.4 in 2018 and continues that recovery with partial 2019 data putting the index above the starting year at 103.5. This recovery is an encouraging sign and it will be interesting to see if it is maintained when full year 2019 data becomes available.
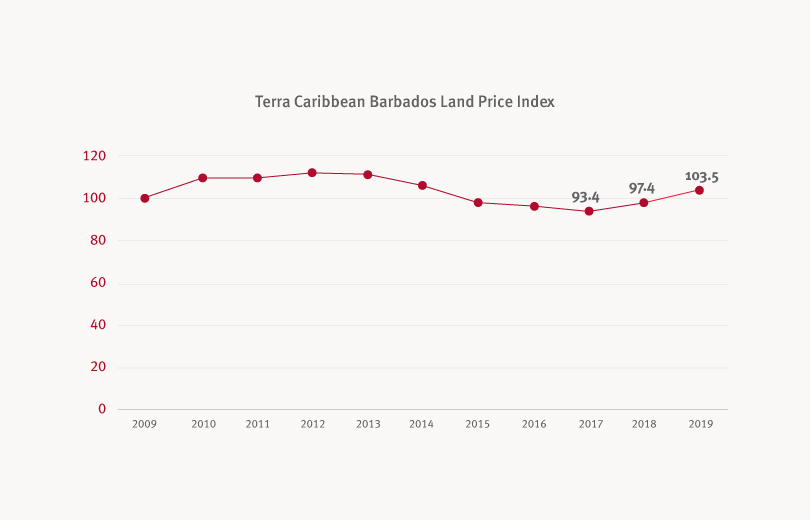
The recovery is an encouraging sign and it will be interesting to see if it is maintained when full year 2019 data becomes available.
Land subdivisions were again a significant feature of the vacant land sales data, with four new developments spread across the parishes of St. James, St. Michael and Christ Church all contributing not only significant volume, but all selling at prices above the median price. However, with the 2019 changes to the Land Tax Rate structure, it is likely that landowners seeking to reduce their tax burden may move to either divest or develop land.
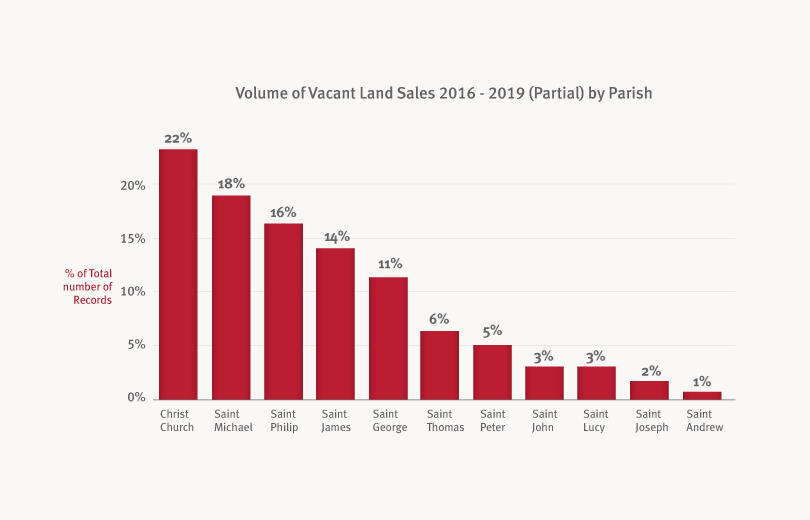
When we look to parish specific data, we see a few changes since our last review. The summary for the data from 2016 to 2019 (partial) shows that while the volume leader is still Christ Church, St. Philip, (which had the second highest volume when the index was last published) has moved to the third highest. Replacing St. Philip for second highest volume is St. Michael which was third last time we examined the data. Beyond these changes, the data still shows the same parishes making up the top five, i.e. Christ Church, St. Michael, St. Philip, St. James and St. George.
Replacing St. Philip for second highest volume is St. Michael…
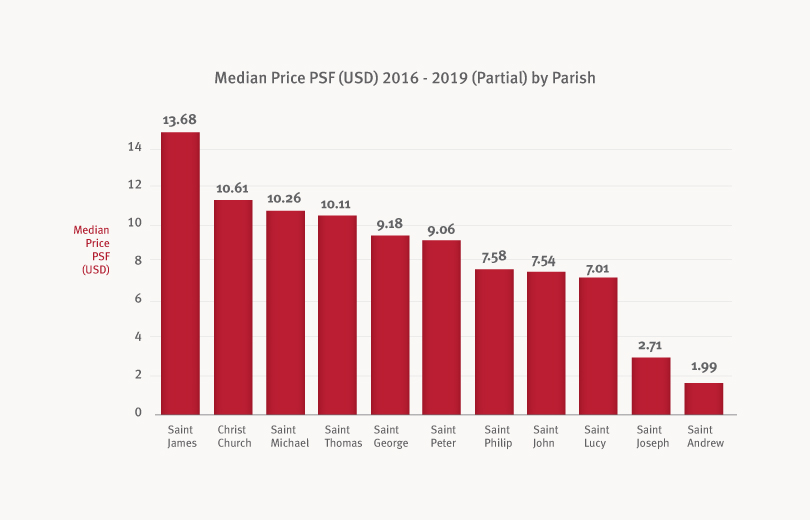
Looking at the median price we see that St. James still maintains the highest median price per square foot across the parishes. This can largely be attributed to several sales in Apes Hill and Royal Westmoreland, areas which command a significantly higher price than the median. However, we see a more pronounced decline in the median price of the bottom two parishes, St. Joseph and St. Andrew, than was evident in previous iterations of the data.
St. James still maintains the highest median price per square foot across the parishes…
We continue to refine our data collection processes to ensure that we have the best data available for compiling all of our indices. We are encouraged by initiatives in the public sector to move to more digital access to information that should be in the public domain. The long-term aim of transparency in public data can only benefit the industry as a whole.