The Foreign Luxury Market
Since the 1870s, a bell has been used at the New York Stock Exchange to signal the opening of trading on the floor. Suffice it to say that in early 2018 the Barbados market was effectively sitting on its hands, mired in uncertainty and perhaps, like traders on the NYSE floor, waiting on a bell to ring. The broader domestic market was characterised by an oversupply of inventory, a marked increase in distressed sales, increased vacancies and continued downward pressure on rents. The proverbial bell rang in the form of 30 seats, an IMF programme, successful debt reprofiling and an unprecedented corporate tax reform.
Overall Market Sales Volume
The numbers are in for 2018 (see Figure 1) and at first glance it would seem the market has responded to the bell. Overall transaction volume is up by just under 10% over the 2017 figures and it is likely that market sentiment has improved by a greater margin. That return of confidence to the market is reflected in the fact that sales volume was up in each quarter YOY following the election bell.
Beyond the broader domestic market, understanding the performance of specific segments of the market (e.g. the foreign luxury market) is a bit more complicated as the data is scarce. The reality is that we are an under-informed market generally and there are certainly a few examples of built developments on the market which would support that assertion. In 2016 we wrote about the supply on the west coast beachfront totalling an eye watering US$1.15B. But what about the absorption rate – what is the actual sales turnover in a ‘season’?
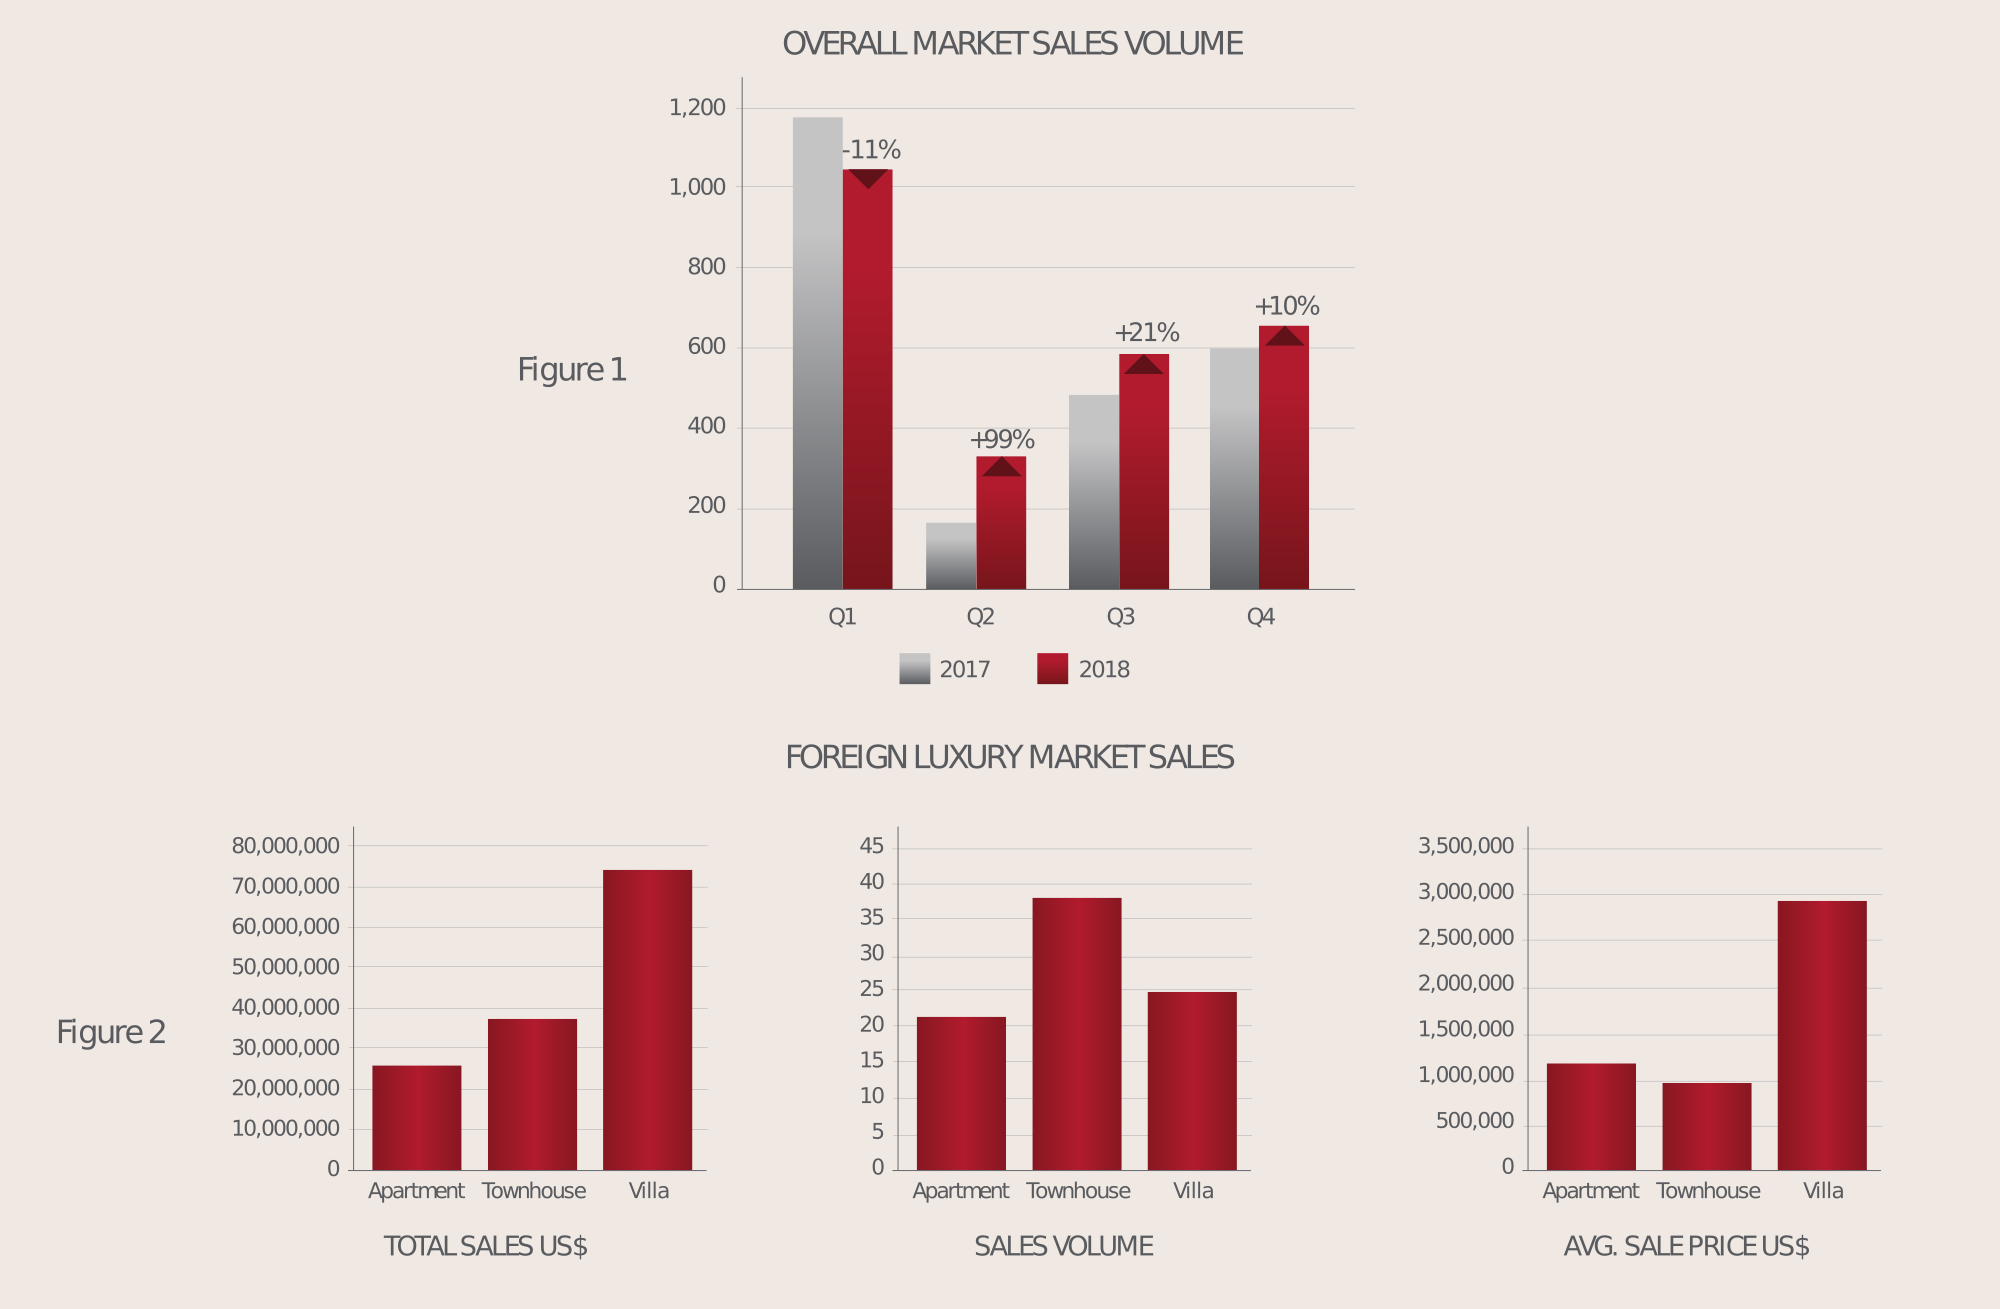
Foreign Luxury Market Sales
This year we set out to get a better understanding of sales volume in the foreign luxury market over a 12-month period. We defined the foreign luxury market as anything on the west coast beachfront; in one of the master planned or themed developments; in any of the prime and ridge-front neighbourhoods such as Sandy Lane, Polo Ridge, Carlton Ridge etc. and beyond that sales at US$1M or above. We looked at completed sales and categorised them by detached Villas, Townhouses, Apartments and Vacant Land parcels. The total estimated sales turnover for calendar 2018 was US$149,275,000 which is well beyond the original estimates from an informal survey of real estate brokers in the market.
Figure 2 illustrates the overall sales activity by property type. Note the volume of vacant land sales was negligible (despite two beachfront sales totaling US$9.5M) so for simplicity we have not included these in the illustrations, however they have been included in the overall number above. On the basis of this absorption rate, the market is likely sitting on a minimum of 15 years of inventory.
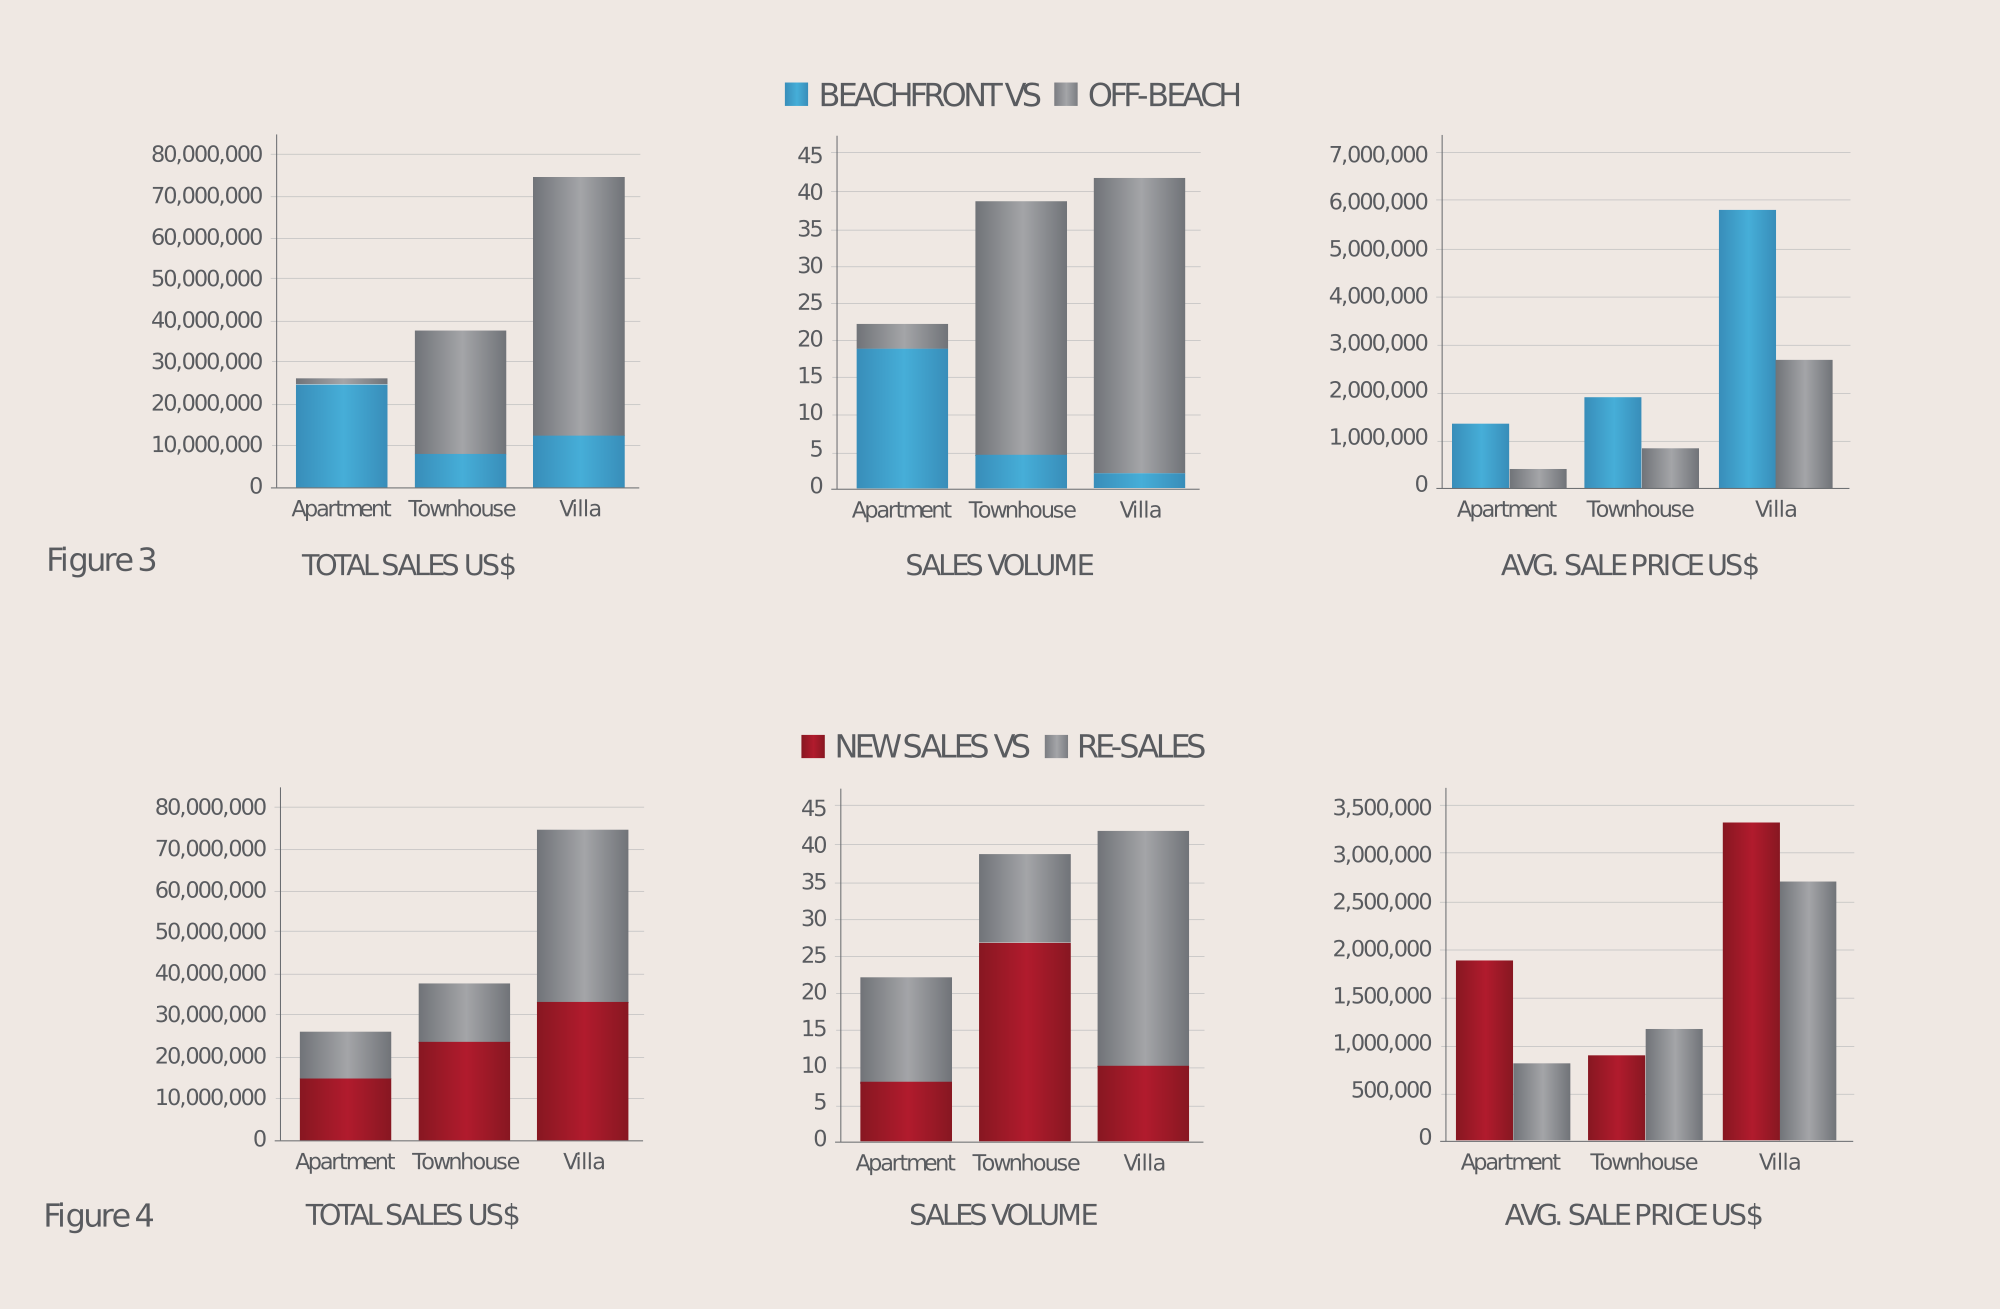
Figure 3 illustrates the beach and off-beach segmentation where perhaps the only developer insight is to reflect carefully before building luxury off-beach apartments. The appetite for off-beach apartments tends to be at the sub-US$450K price point. Notable is the volume of townhouse sales, largely attributable to the Westmoreland Hills development which had a strong market response in 2018. Not illustrated here but we also looked at the absorption within all the major developments on the market and without question Royal Westmoreland experienced the highest sales volume by a substantial margin. Market confidence in the development has remained consistently strong over the years.
Trophy Sales
Notably absent from the sales data in 2018 was the Trophy Villa category ( > US$15M). Typically, the market absorbs one of the listed trophy villas each year, however there have been no sales since one on Gibbs beach in 2014. The highest value villa sale in 2018 was a beachfront property which sold with an adjacent cottage at US$8.5M. Suffice to say there is considerable supply in the trophy segment, both built and proposed. This reflects the pendulum shift away from condo development and into the luxury villa product which was thought to be the next development frontier. The market is simply not as deep as we might think at that level, hence the excess inventory and prolonged marketing periods. Consider the fact that there were about 90 sales with a gross sales value of US$150M in the data set for 2018, while the top five villas on the market are listed at a combined US$156M with an average asking price of US$31.2M. Look for the pendulum to swing back towards hotel development which is where it started prior to the condo boom of the mid-2000s.
Summary
In 2019 look for continued softening of pricing in the oversupplied segments. We may see informed capital flowing back into the market, likely in the new hotel development space with established brands. The long-stay tourism data says that on its current trajectory, the US market is on course to surpass the UK as our primary source market within two or three years and the arrival of the ROSS Medical University will further enhance traction in that market. At this point there is no demonstrable evidence of an increase in appetite (sales) from the US market, but the prospects are increasingly positive.
It would appear that after ten years of sluggish market conditions, and with a noted increase in trading volume and sentiment over 2018, we can say that the trajectory of the market appears to be changing. Perhaps 2019 is as good a time as any to get back into the market!