Terra Caribbean Barbados Land Price Index 2023
This index uses the median price per square foot of vacant land sales in Barbados to track the shift in price trends over time from the base year of 2015. This includes residential, commercial, and agricultural land. Median values are used for indices as these resist the influence of outliers in our relatively small datasets. The median is less sensitive to outliers compared to the average. A single outlier can significantly impact the average, pulling it away from the central tendency of the data. On the other hand, the median is less affected by such extreme values since it only considers the middle value.
Based on data for 2022 the index rose to just above the base year at a value of 101.2, or 1.2% above the median value of 2015. The partial data up to the end of June 2023 shows the index has dipped slightly resulting in a value of 98.6 or 1.4% below the base year as shown in Fig. 1 below:
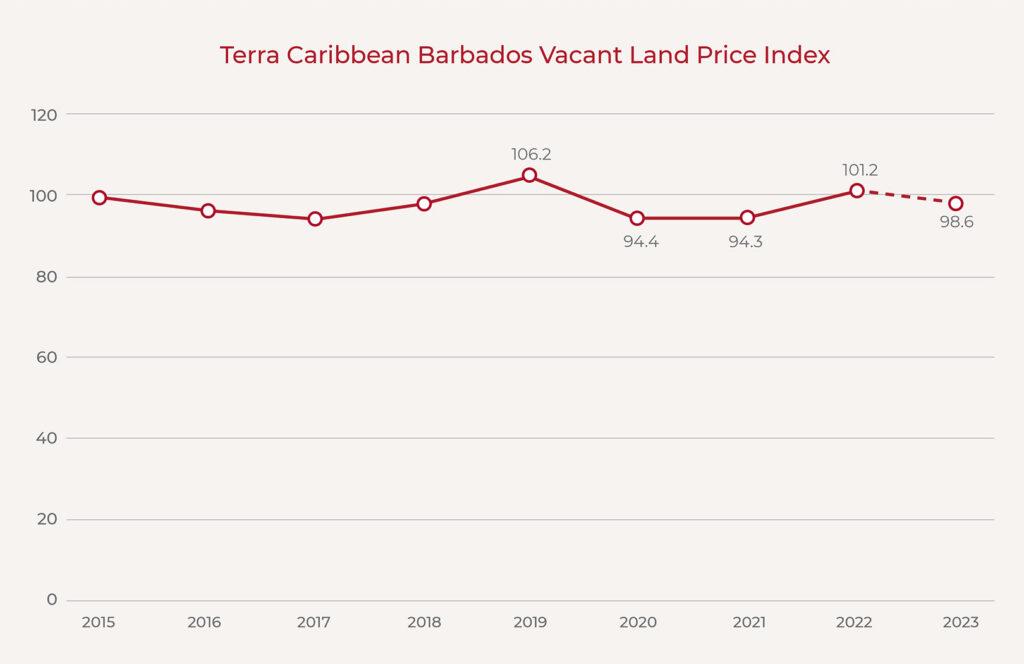
Fig 1. Terra Caribbean Barbados Vacant Land Price Index 2023
Percentage of Sales by Parish
Residential developments continue to be one of the main drivers for vacant land sales, with the top five developments regularly accounting for close to 20% of vacant land sales in recent years. These include developments like South View and Little Kent in Christ Church, Lears Court in St. Michael and Welches Estate in St. James. Fig. 2 below shows the percentage of land sale transactions by parish for the period Jan 2020- June 2023 in comparison to result for the period Jan 2019 – June 2022.
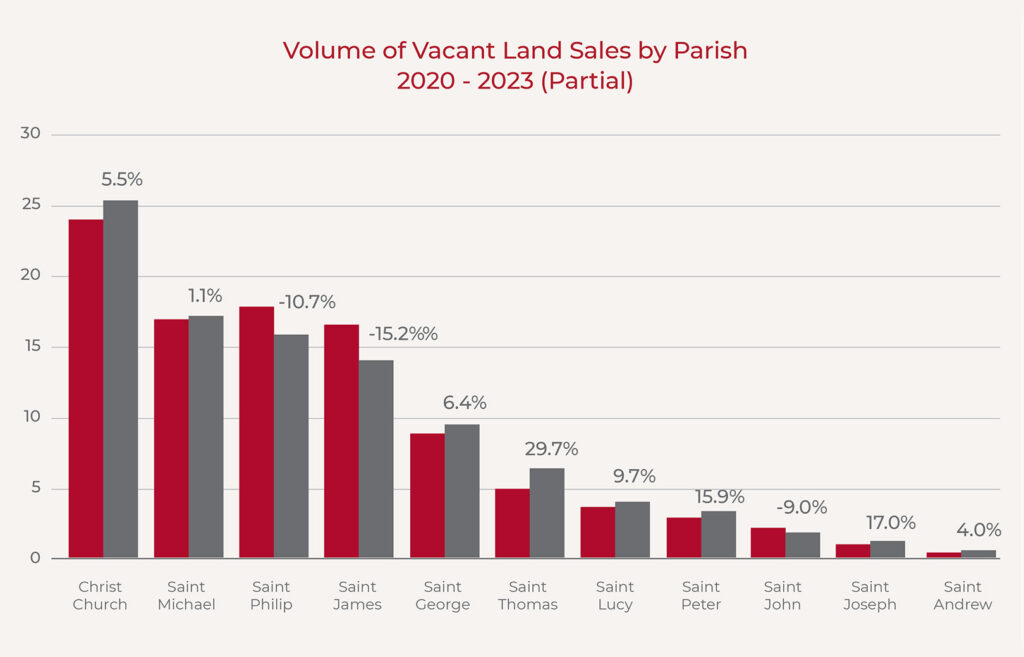
Fig 2. Percentage of Vacant Land Sales 2020 – 2023 (Partial) by Parish
Drilling down into more detail we can see the impact of several developments having fewer available plots as they mature and lots are sold, with notable declines in sales in Lears Court and developments in Kent e.g. South View and the Welches area e.g Welches Estate.
We must also note several land and home developments that provide options at competitive prices without the need to navigate the building process. Developments like Harmony Estates, Atlantic Breeze and similar have been very popular and maybe a contributing factor in the decrease in volume of vacant land sales as buyers are purchasing house and land.
Median Price Per Square Foot (USD) by Parish
As has been the case historically, St. James commands the highest median price, with St. Michael
a close second, however, whereas in 2022 the price gap between St. James and St. Michael was $2.7, from Jan 2020 to June 2023, the gap has been reduced to $1.8. The only other significant movement was in the parish of St. Andrew, which while having the lowest PSF value, has however seen an increase from $1.8 to $3.5. While the shift is notable, the low volume of transactions in St. Andrew, means that a few transactions at much higher PSF values than typically occur, have caused this shift.
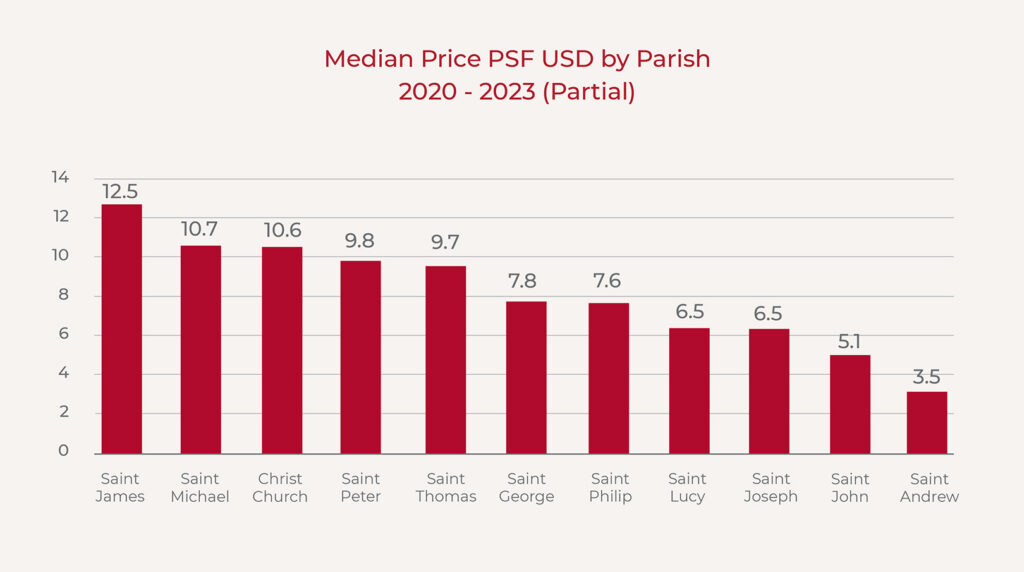
Fig 3. Median Price PSF (USD) 2020 – 2023 (Partial) By Parish
Whilst there has been some swapping in the position of the parishes compared to the previous index, there were no significant shifts in actual values. The lack of real movement in the per parish metrics is not surprising given the small movement in the overall index which reflects some stability in market prices.