Price in the New Market
How much longer can we continue to be romantic about the glory days of 2008? Property values have changed substantially since then, however property ‘prices’ have not necessarily followed suit.
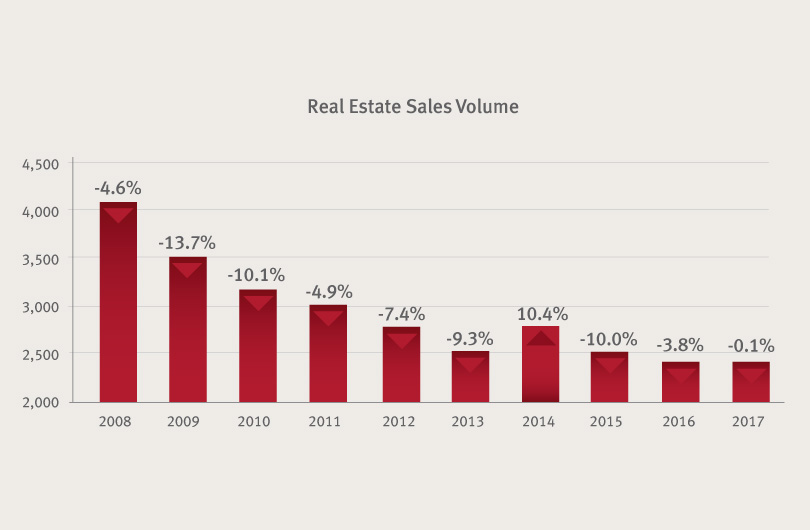
The transaction volume numbers are in for 2017 (see Figure 1) and by and large it seems the market has flattened out since 2015 and is down just 0.1% from 2016. The footnote here is this still translates to the lowest sales volume on record in the last 25 years.
With the considerable amount of inventory on the market, perhaps it’s time for vendors to join together in universal acceptance that the old market is gone and the new market is here to stay – at least for the foreseeable future. There is certainly one group of market participants that is very much aware of the new market, and that is the buyers.
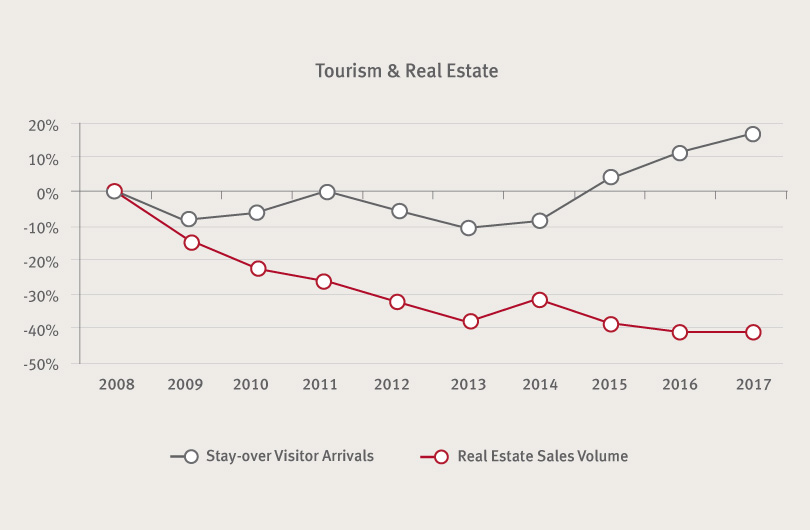
It is an interesting side-bar to note that the real estate market has generally been on an opposing trajectory with the tourism market (stay-over visitors) over the last 10 years. This is particularly evident over the recent 5 years where stay-over visitor arrivals are up 30% and in particular during 2017 where arrivals were the highest on record (contrasted by real estate sales volume being the lowest on record*). The chart below illustrates the annual percentage change for real estate sales volume and tourism arrivals from a baseline in 2008.
Price is Key
With volume flat, and most of the market still in oversupply, the ‘elephant’ in the market continues to be price. A substantial segment of the market has grudgingly re-priced and generally that is where the market is moving. The repricing effort has been driven in part by lending institutions marketing and selling distressed properties at scale. Repricing is taking place at all levels of the market, from modest single-family dwellings in the country to luxury beachfront villas (there is one which had a US$15M reduction and is still looking for a buyer). Those vendors that continue their romance with the old market (and there are many) are finding their properties sitting for protracted exposure periods.
Exposure Periods
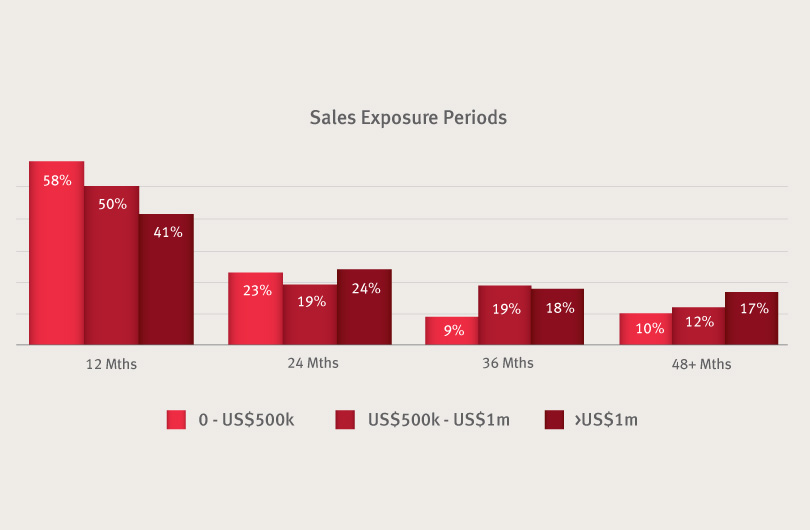
Figure 3 above illustrates the average “months on the market” for properties sold in the recent three-year period* by price segment. Overall the data indicates that 50% of the properties sold were listed on the market for 12 months or less, 72% for 24 months or less and approx 90% for 36 months or less. This is notable when one considers the staggering volume of inventory which has been sitting on the market in excess of 5 years and in some cases for 10 years or more. The data also illustrates the correlation between higher priced properties and longer marketing periods, but no surprise there.
Notable is the fact that those properties listed for 36 months at the point of sale, generally had the highest number of recorded price reductions over the exposure period. The punch line for sellers with properties listed in excess of 36 months is they have likely carried their property unnecessarily and followed the market down.
Cash Yields
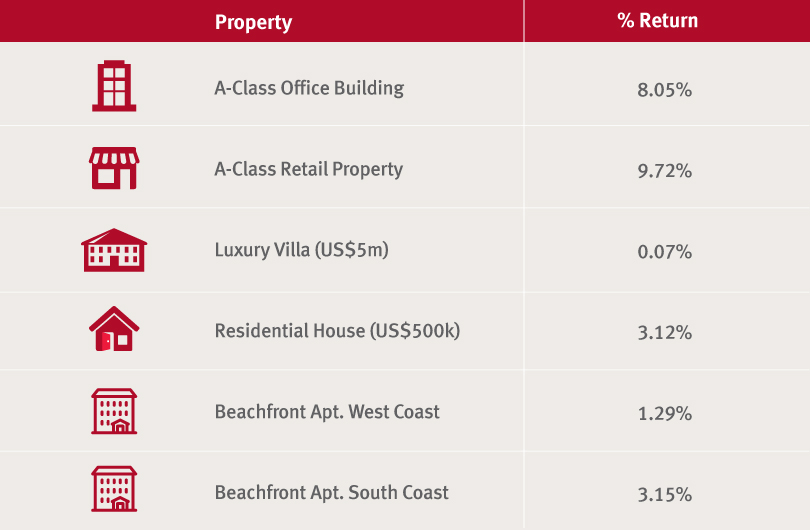
It’s one thing to hold a property over a 36 month period if there is a reasonable cash yield. A reasonable yield would cover running costs, include a capex provision and provide some measure of return on the property. Figure 4 illustrates our observations of the unleveraged cash returns generated from the various property segments.
Suffice to say the market has a habit of overestimating cash returns and also of excluding a responsible provision for capex annually in the calculation. The majority of residential properties are yielding marginal returns (negative in the case of many luxury villas once prime weeks are blocked for owner use) and hardly warrant holding a property for longer than necessary.
Summary
The prospects for market growth in the next 12 months are distant and at minimum on the other side of the 2018 elections. Two obvious items on the watch list would be a GDP growth rate at 2% or better (best estimates are well below this) and a Sterling somewhere around $1.50 or better (again outside most conventional thinking in the next 12 months). In any event, with growth unlikely in 2018 and inventory in oversupply, price is key in the new market. Those vendors with properties sitting on the market for protracted periods would be well served to mark their prices to market or to get comfortable for the long haul.