Commercial Market Insight: Trinidad & Tobago
Terra Caribbean Trinidad has collated data from over forty buildings and produced our annual Commercial Rental Rate Study for over a decade. Our study, which focuses on A Class, B+ Class and B Class buildings within high demand areas, is based on data extracted from our proprietary database.
In 5 short years, 2014 to now, the commercial office rental real estate market has taken a steep nosedive into near stagnation. In our 2014 survey, we highlighted that the market was buoyant with demand outweighing the supply of A Class and B Class office space.
Since then, in response to a worldwide decrease in the demand for oil and by-products of oil, large corporations of the petrochemical industry have downsized operations globally, as well as in Trinidad. Consequently, the vacancy rate of private office rental space has increased to as much as 25%. This in turn has affected the Average Rental Rate per square foot of A, B+ and B Class Buildings, with A Class buildings affected the most.
Rental Rates
In our analysis below, we have compared A Class, B+ Class and B Class buildings, within the same area of Port of Spain, over a 12 year period. All buildings selected are within walking distance of each other and face the same challenges of traffic congestion, offsite parking and proximity to amenities. Thus, all other factors being equal, the primary variable in this evaluation is the Class of each building.
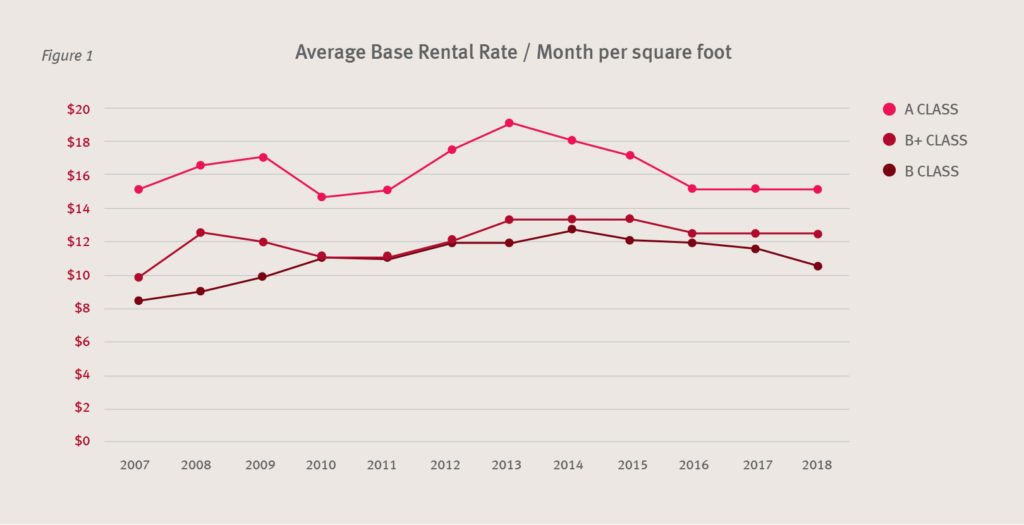
The information shows that the current commercial office rental market is conducive for tenants to relocate from substandard accommodations to superior, more modern buildings.
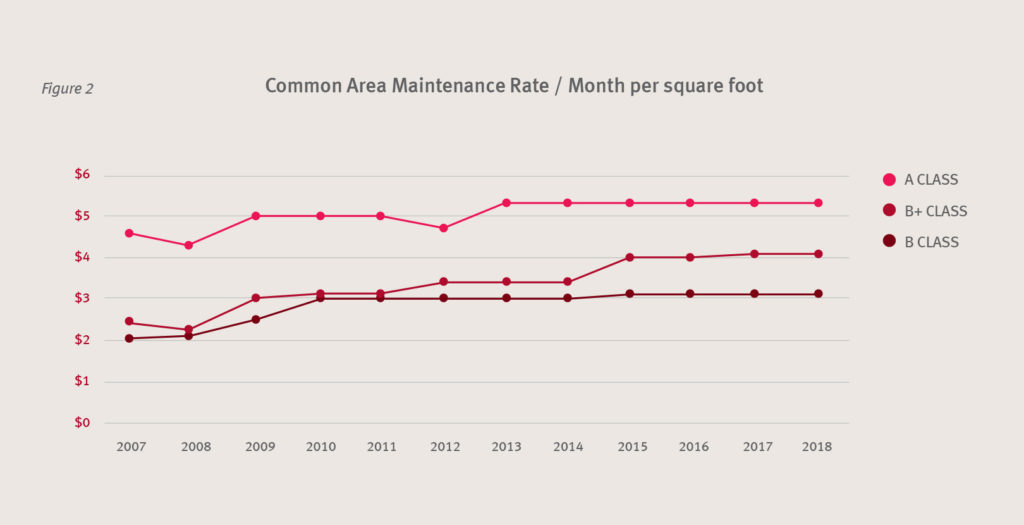
Common Area Maintenance (CAM)
Unlike monthly per square foot rental rates, Common Area Maintenance (CAM) rates are not subject to the ebbs and flows of the economy.
Fundamentally, CAM is determined by the aggregate cost of maintenance of a building’s common areas, shared internal services and statutory expenses and can change based on the age of the building, the level of maintenance and peripheral factors such as inflation and labour costs. The tenant’s share of CAM is calculated proportionate to their respective space rented as a percentage of the entire Net Rentable Area of the building. Consequently, due mainly to the increases in vacancy rates in A Class buildings, there has been pressure on CAM rates as building owners have carried the shortfall in CAM as seen in the chart below.
Commercial Sales Trends
The turbulent commercial rental market has translated into a contraction in the commercial sale market of office buildings. As commercial developers adjust to recovering capital outlays over longer investment periods due to the unpredictable market, demand for commercial sales has weakened as illustrated, based on our data, in the chart below.
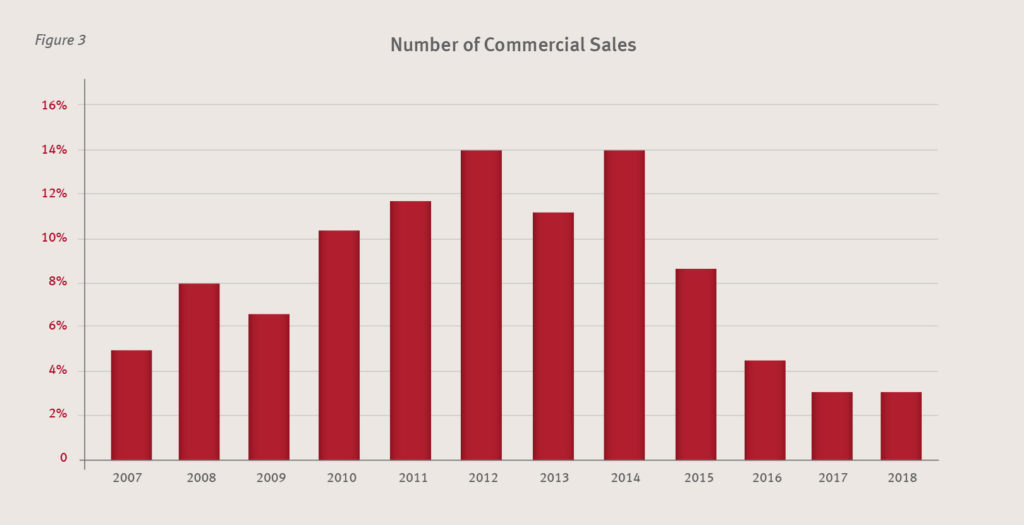
Our information is an amalgamation of Terra Caribbean transactions and market transactions to provide a comprehensive picture of the segment. While this data does not encompass all commercial sales in this segment over the 12 year period, sufficient data was gathered to render it representative of the commercial sale segment.