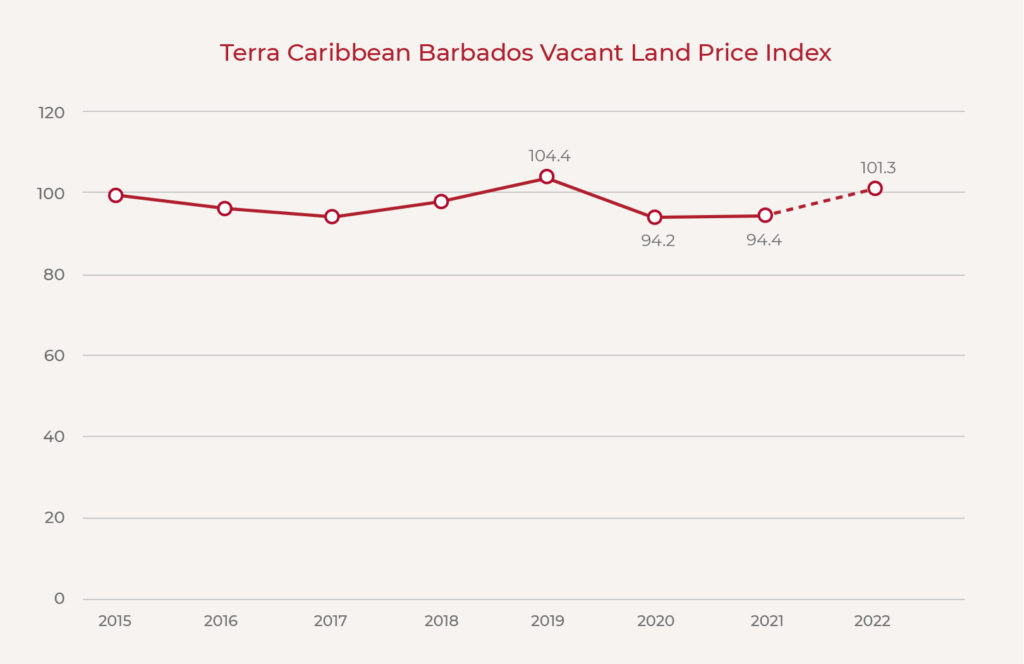
From a peak in 2019 we have seen the index fall in 2020 and 2021 to below the benchmark year of 2015. This can be partially attributed to price reductions in some older developments, and market conditions due to COVID -19 pandemic which saw individuals and developers willing to adjust prices. Data up to the end of September 2022 now indicates there has been some price recovery, with the index reflecting median pricing above the 2015 base year.
Volume of Sales by Parish
Residential developments continue to be the driving force in the sales of vacant land. Shown below is the distribution of transactions by parish during the period (Jan 2019 – Sept 2022).
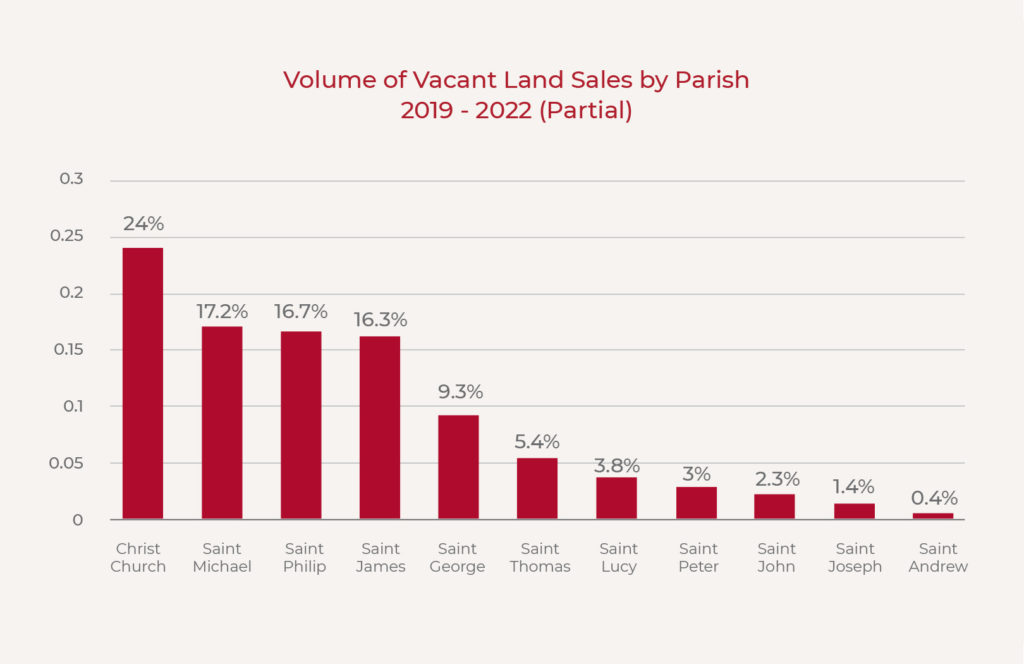
Christ Church thus far appears to be the volume leader for sales by parish- largely based on multiple developments along the Highway R corridor for example The Grove and South View. However, St. George, St Phillip, St James and St Michael have also experienced rising as more of developments spread from the coast into central Barbados.
Median Price Per Square Foot by Parish
When it comes to the median price PSF, St James continues to achieve the highest price point by an even wider margin than in our previous index. In our 2021 index review, we saw a gap of just $1.3USD PSF which has now widened to $2.7USD PSF. The next two parishes are the traditionally strong southern parishes of St Michael and Christ Church – same as in our 2021 index.
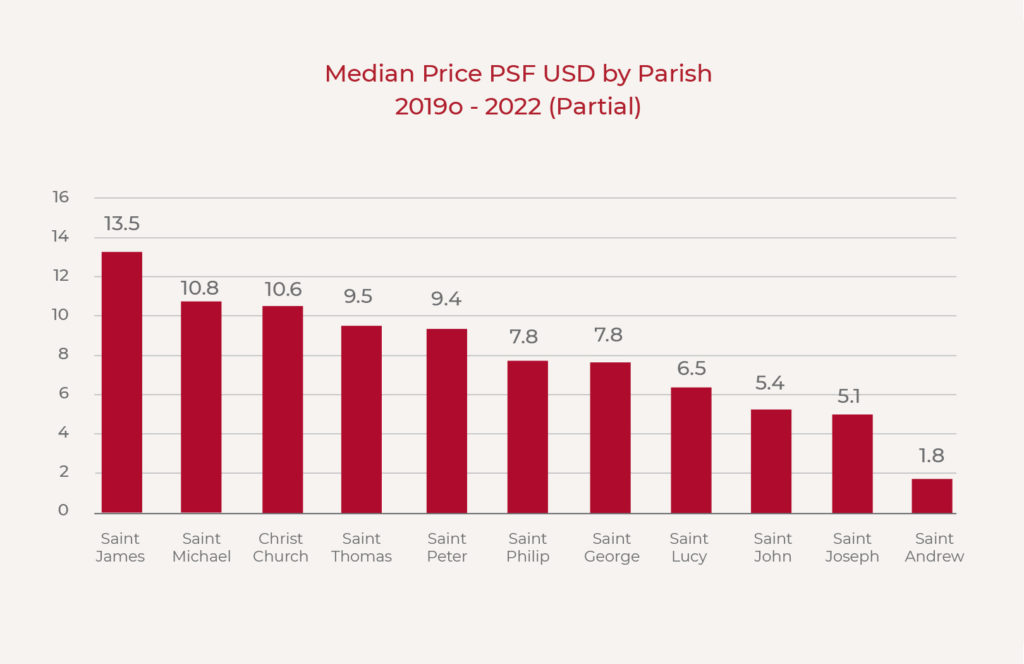
Whilst there has been no change in the top three parishes there has been somewhat of a shuffle in the rest of the table largely due to St George moving from fourth in 2021 to seventh in the current iteration. St Joseph and St Andrew have also swapped places with St Andrew having the lowest median price this year.



I am trying to find out the price of land in Barbados.
Agricultural and residental as I currently have just over 2 acres in St lucy